Most teams think they’re improving. They run meetings, collect feedback, and tweak processes. But without real evaluation data, they’re just guessing. And guesswork doesn’t scale. The companies that keep getting better-year after year-don’t rely on gut feelings. They use evaluation data to build continuous improvement loops. Not once. Not occasionally. Every single week.
What a Continuous Improvement Loop Actually Looks Like
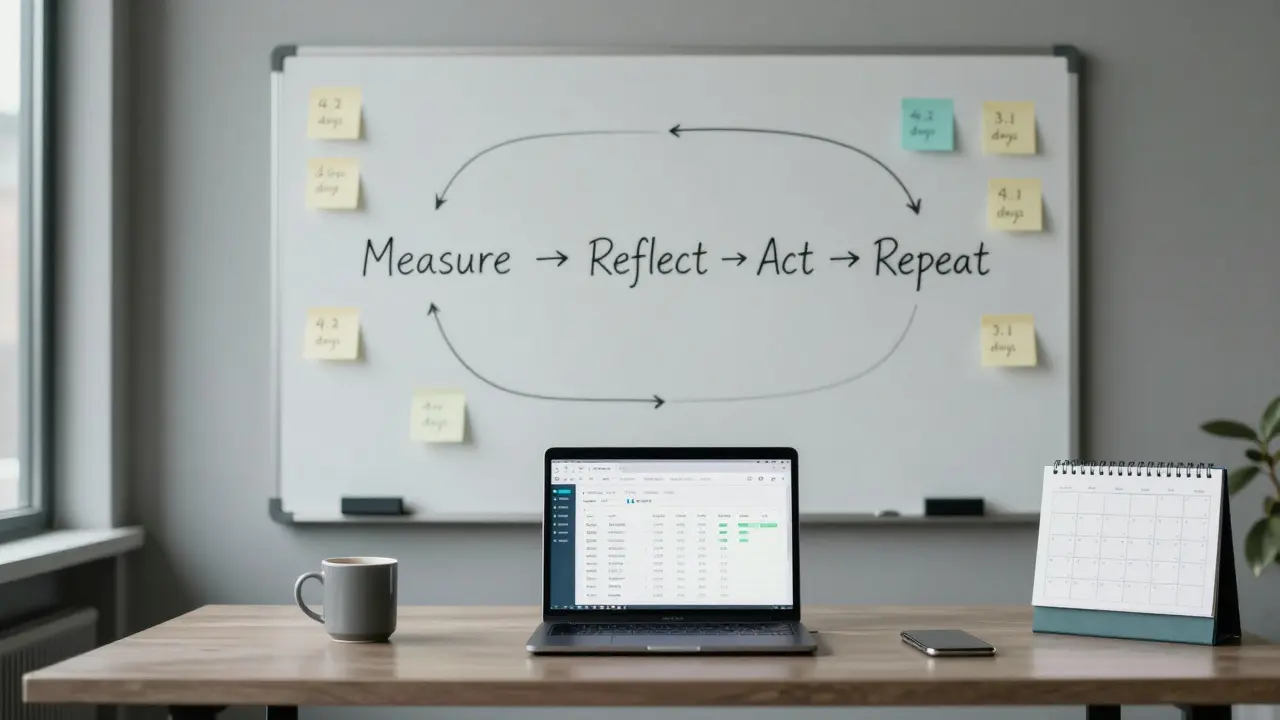
It’s not a fancy diagram with arrows. It’s a simple rhythm: measure, reflect, act, repeat. You start by collecting hard numbers-not opinions. How long does it take to close a support ticket? What percentage of customers renew after their first month? How many errors slip through QA? These aren’t vanity metrics. They’re your compass.
Once you have the data, you sit down with your team and ask: What’s working? What’s broken? What’s missing? No blame. No excuses. Just facts. Then you pick one thing to change. Not five. Not ten. One. You test it for two weeks. Then you measure again. If the number got better, you lock it in. If not, you try something else. That’s the loop. Simple. Repeatable. Powerful.
Why Most Improvement Efforts Fail
Here’s the truth: teams don’t fail because they’re lazy. They fail because they’re busy. They’re drowning in Slack messages, Zoom calls, and half-finished initiatives. So when someone says, “Let’s improve our onboarding,” everyone nods. Then they go back to their screens and forget about it.
The real problem? They’re not using evaluation data to guide the change. They’re using anecdotes. “I heard Sarah had trouble with the form.” “Tom said the training was too long.” That’s not a system. That’s noise.
Look at companies that get this right. Take a SaaS startup in Edinburgh that cut customer churn by 37% in six months. They didn’t overhaul their product. They didn’t hire a new team. They started tracking one thing: how many users completed their first key action within 48 hours of signing up. If it dropped below 65%, they paused everything and dug into why. Maybe the email sequence was too slow. Maybe the tutorial video was confusing. They found it. Fixed it. Measured again. And kept going.
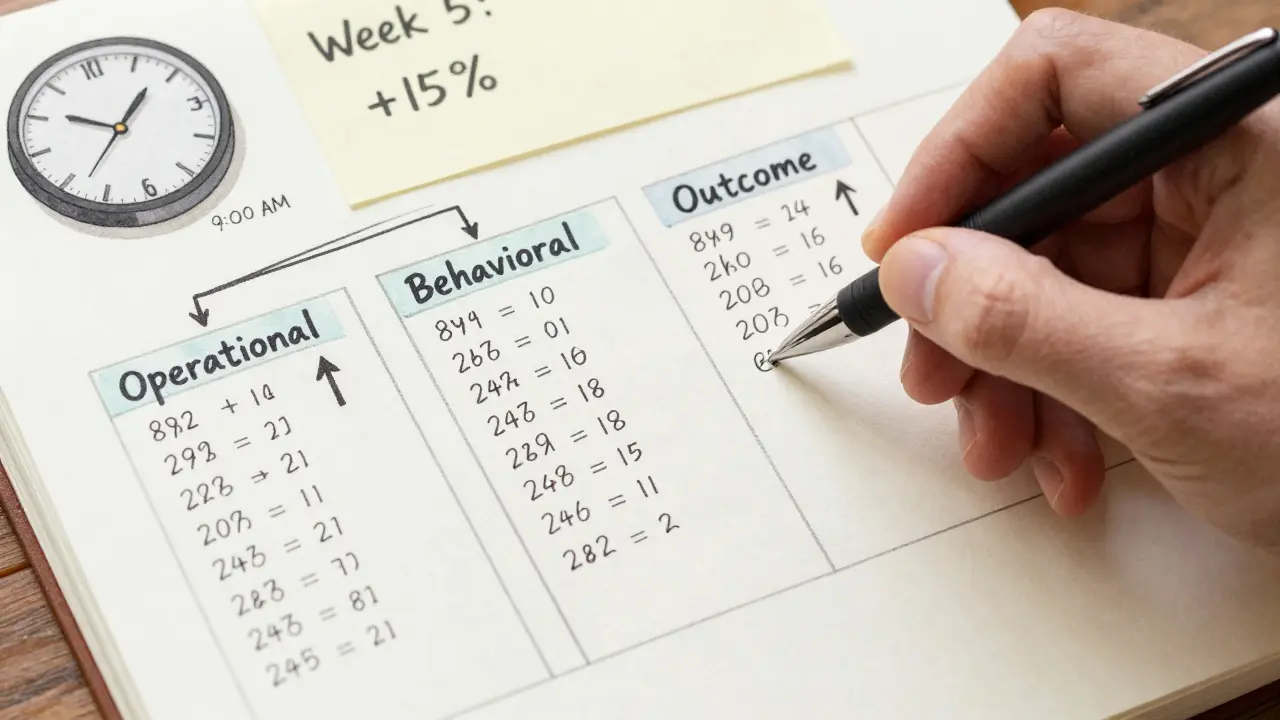
The Three Types of Evaluation Data That Matter
Not all data is created equal. You need three kinds to build a real improvement loop:
- Operational metrics - the numbers that show how your system runs. Cycle time, error rates, throughput, uptime. These tell you if your machine is working.
- Behavioral data - what people actually do, not what they say. Click paths, feature usage, drop-off points. This reveals hidden friction.
- Outcome metrics - the business impact. Retention, revenue per user, referral rate. These answer: “Did this change make a difference?”
Ignore one of these, and your loop breaks. If you only track operational metrics, you might make things faster-but users still quit. If you only track outcomes, you won’t know why things changed. You need all three.

How to Set Up Your First Loop (Step by Step)
Start small. Don’t try to fix everything. Pick one process that hurts. Maybe it’s invoice approvals. Maybe it’s onboarding new hires. Here’s how to begin:
- Define the metric - What’s the single most important number for this process? (e.g., “Time from invoice receipt to payment”)
- Collect baseline data - Pull the last 30 days. Don’t estimate. Use real numbers.
- Set a goal - Aim for a 15-20% improvement. Too ambitious? You’ll burn out. Too easy? You won’t learn anything.
- Run one experiment - Change one thing. Maybe automate the reminder email. Maybe assign a single person to own approvals.
- Measure after two weeks - Did the number move? If yes, document it. If no, try something else.
- Repeat every week - Make this part of your team’s rhythm. Put it on the calendar. No exceptions.
That’s it. No consultants. No expensive tools. Just discipline.
Tools That Help (Without Overcomplicating Things)
You don’t need a data warehouse. You don’t need a BI team. Here’s what actually works:
- Google Sheets or Airtable - For small teams, a simple table with dates and metrics is enough. Automate data pulls with Zapier if needed.
- Notion dashboards - Great for combining metrics, notes, and action items in one place.
- Slack integrations - Set up weekly automated reports. “Last week, invoice approval time dropped from 4.2 to 3.1 days.”
- Customer feedback tools - Like Typeform or Delighted. Ask one question after key interactions: “How easy was this for you?”
These tools don’t make you smarter. They just make your data visible. And visibility forces accountability.
When to Stop Improving (Yes, There’s a Time)
Improvement isn’t endless. If you’ve hit a plateau-say, invoice approvals are stable at 2.5 days and have been for three months-you’re not stuck. You’re optimized. That’s good. Now move to the next bottleneck.
Don’t keep tweaking what’s already working. That’s called perfectionism. And it kills momentum. The goal isn’t perfection. It’s progress. One loop at a time.
Real Example: A Small UK Agency That Cut Delays by Half
A digital marketing agency in Glasgow had a recurring problem: client reports were always late. They blamed “too many revisions” and “client delays.” But they never measured it.
One manager pulled the data. Turns out, 72% of delays happened because the internal review step took 5-7 days. No one owned it. No one tracked it. They assigned a single person to manage report drafts. They set a hard deadline: 48 hours to review. They automated reminders. Within six weeks, report turnaround dropped from 7 days to 3.5. Client satisfaction scores went up. And the team stopped feeling like they were always firefighting.
That’s the power of a loop built on data-not drama.
Common Mistakes to Avoid
- Waiting for “perfect” data - You don’t need 100% accuracy. You need enough to see the trend.
- Measuring too many things - Pick one. One metric. One change. One cycle.
- Not sharing results - If the team doesn’t see the improvement, they won’t believe in the process.
- Blaming people - The system is the problem, not the person. Always assume the process is broken, not the employee.
- Skipping the reflection step - Measuring without talking about it is just data collection. Not improvement.
Why This Works Better Than Annual Reviews
Annual reviews are dead. They’re retrospective, emotional, and disconnected from daily work. Continuous improvement loops are the opposite: frequent, factual, and forward-looking.
Instead of asking, “How did you do last year?” you ask: “What did we learn last week?” That shift changes everything. It turns feedback from a performance judgment into a learning tool.
Teams that use this method don’t just get better. They become more confident. Less stressed. More in control. Because they know what’s working-and they know how to fix what isn’t.
Do I need special software to build a continuous improvement loop?
No. You need consistency, not software. Start with a spreadsheet, a calendar, and a team that’s willing to look at the numbers. Tools like Airtable or Notion help, but they’re not the point. The point is making data visible and acting on it weekly.
How often should we run these loops?
Weekly. Every team should have a 30-minute slot on their calendar for this. No exceptions. If you wait longer, momentum fades. If you do it too often, you’ll burn out. Weekly is the sweet spot-it’s frequent enough to catch problems early, but not so often it becomes a chore.
What if my team resists data-driven changes?
Start with a small win. Pick a process everyone agrees is broken. Show them the data. Let them propose the fix. When they see the number improve because of their idea, resistance turns into ownership. People don’t hate data-they hate being told what to do. Give them control, and they’ll follow.
Can this work for remote teams?
Yes. In fact, remote teams benefit more. Without face-to-face chats, data becomes the common language. Use shared dashboards, weekly video check-ins, and automated reports. The lack of physical proximity makes transparency even more important-and this method thrives on it.
How long until I see real results?
You’ll see small wins in 2-4 weeks. Big changes-like lower churn, faster delivery, or higher satisfaction-take 3-6 months. But the real benefit? Your team stops feeling stuck. They start feeling capable. That shift happens fast.

Comments (8)
Megan Blakeman March 14 2026
I love this so much. Seriously. It’s like someone finally put into words what I’ve been trying to tell my team for years. Measure, reflect, act, repeat. It’s not magic. It’s just… consistency. And yeah, I’m crying a little. 🥹 We started with invoice approvals last month-used a stupid Google Sheet-and now we’re at 2.3 days. From 6. We didn’t even hire anyone. Just… paid attention. Thank you.Akhil Bellam March 14 2026
Oh, here we go again-the ‘just track one metric’ gospel. How quaint. In my 17 years at McKinsey, we never reduced churn by tracking ‘key actions within 48 hours.’ That’s toddler-level analytics. Real improvement requires granular cohort analysis, predictive churn modeling, and dynamic KPI weighting. Your ‘Google Sheets’ approach is charming, darling, but it’s not scalable. It’s a spreadsheet, not a strategy.Amber Swartz March 15 2026
I’m so tired of people acting like this is some revolutionary idea. 😤 Like, wow, you’re telling me we should use DATA? Not vibes? Not ‘I think Sarah’s upset’? Who even still does that? My team had a meltdown last week because someone said ‘maybe we should try something new’ and we all just stared at each other like we were in a rom-com. This is basic. Basic! And yet-everyone acts like it’s a TED Talk. 🙄Robert Byrne March 17 2026
You’re right about the three types of data-but you missed something critical: context. Metrics without narrative are just noise. You can say ‘cycle time dropped 20%’ but if no one knows why, you’re just optimizing a ghost. That’s why reflection isn’t optional-it’s the glue. And if your team can’t articulate why a change worked? You didn’t improve. You just got lucky. Fix the culture first. The numbers will follow. And stop using ‘vanity metrics’-they’re not metrics. They’re distractions.Tia Muzdalifah March 18 2026
this is so relatable 😭 we just started doing this for our content calendar and holy cow. we went from ‘who even made this post?’ to ‘oh wait, we’re actually publishing on time’ in 3 weeks. no fancy tools. just a shared doc and a 5-min standup. also, i misspelled ‘document’ as ‘documnet’ in the first week. we laughed. then we fixed it. progress, not perfection. love this.Zoe Hill March 20 2026
I just wanted to say thank you for this. 🌸 I’ve been so burnt out lately, and this reminded me that improvement doesn’t have to be loud. Sometimes it’s just one person saying, ‘Hey, let’s see what the numbers say.’ We started tracking how long it took to respond to Slack messages (yes, really). It went from 8 hours to 2.5. We didn’t even change anything. We just saw the pattern. And now? People feel seen. That’s everything.Albert Navat March 21 2026
Look, I get the enthusiasm, but let’s not romanticize this. This isn’t ‘simplicity.’ This is operational hygiene. You’re talking about baseline KPIs that every mature org implements in Q1 of Year 1. If you’re still using Airtable to track invoice approvals, you’re not ‘building a loop’-you’re avoiding enterprise-grade tooling. The real win is when you integrate this into your CI/CD pipeline, auto-trigger alerts via Prometheus, and embed feedback loops into your Jira workflows. Until then? You’re just automating Excel sheets. And that’s not innovation. It’s janitorial work.King Medoo March 21 2026
I’ve seen too many teams fall into this trap. They think ‘one metric’ means ‘one focus.’ No. It means ‘one entry point.’ The real danger isn’t measuring too much-it’s measuring without depth. You track ‘time to approval’? Fine. But what’s the variance? Is it consistent? Are outliers being ignored? Are you controlling for holidays, workload spikes, or team turnover? If you’re not asking these questions, you’re not improving-you’re deluding yourself. And don’t get me started on ‘weekly check-ins.’ If you’re not documenting root causes, you’re just performing a ritual. 🤔📉 This isn’t about tools. It’s about intellectual rigor. And if your team can’t handle that? Then maybe you’re not ready for improvement. Maybe you’re ready for therapy.