
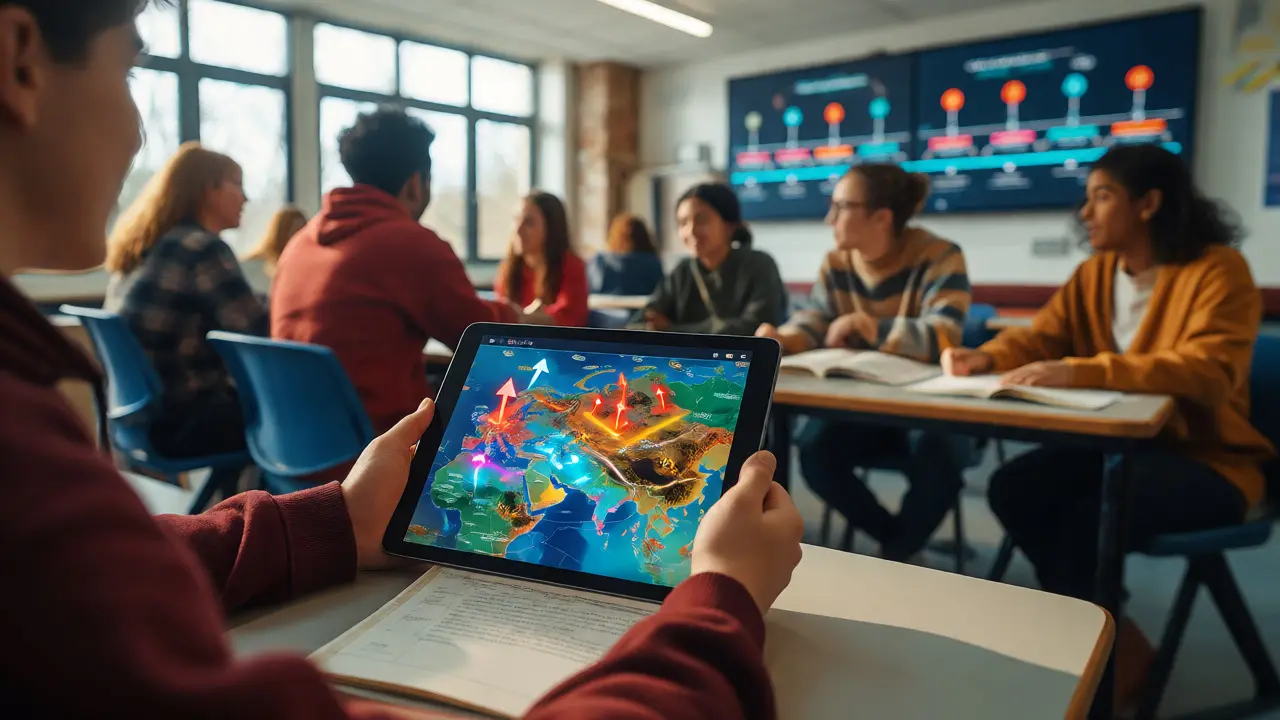
You know that look. The glazed eyes of a student trying to memorize dates or locate a river on a blank map. It’s painful for everyone involved. But what if you could turn that static page into a living, breathing experience? Interactive Maps are digital tools that allow users to explore geographic data through zooming, panning, and clicking specific locations. They transform passive reading into active discovery. When paired with Educational Timelines, which visual representations of events in chronological order, often allowing users to click through eras, they create a powerful combo for History and Geography courses.
This isn't just about making slideshows prettier. It's about cognitive load. Traditional textbooks force students to hold spatial and temporal information in their working memory simultaneously. Interactive tools offload that burden. You click a battle site, see the terrain, then drag a slider to watch troop movements over time. Suddenly, the "why" becomes obvious. Let's break down how to use these tools effectively without getting bogged down in tech support nightmares.
Why Static Visuals Fail Modern Learners
Think back to your own schooling. Did you learn more from a list of dates or by seeing cause and effect unfold? Most people struggle with abstract sequences. A timeline on paper is linear and fixed. If you miss one event, the whole narrative collapses. Digital Timelines solve this by offering non-linear exploration. You can jump to the Industrial Revolution, then backtrack to the Agricultural Revolution to see the precursor changes.
In Geography, static maps lack context. A map showing trade routes doesn't tell you why those routes existed. An interactive layer might show wind patterns, resource distribution, and political borders all at once. This multi-layered approach mirrors how historians and geographers actually think. They don't view data in silos; they see connections. By giving students access to these layers, you teach them analytical thinking, not just rote memorization.
Engagement spikes when agency is present. Students who control the pace of information retention improve significantly. A study from the University of Cambridge noted that students using interactive historical simulations retained factual details 40% better than those using traditional texts. Why? Because they had to make decisions. Where do I click next? What does this border change imply?
Choosing the Right Platform for Your Classroom
You don't need a PhD in computer science to pick a tool. Start simple. The market is flooded, but only a few stand out for reliability and ease of use. Here is a quick comparison of the heavy hitters in this space.
| Tool Name | Best For | Ease of Use | Cost | Key Feature |
|---|---|---|---|---|
| StoryMap JS | Narrative-driven history lessons | High | Free / Freemium | Combines maps and stories seamlessly |
| Knight Lab Timeline | Simple chronological projects | Very High | Free | Clean interface, no login required for viewers |
| Google Earth Studio | Advanced geography animations | Moderate | Free (with Google account) | 3D fly-throughs and satellite imagery |
| TimelineJS | Data-heavy historical events | Moderate | Open Source | Powered by spreadsheets, highly customizable |
If you are new to this, start with Knight Lab Timeline. It strips away the clutter. You enter dates, titles, descriptions, and images. That's it. It works on tablets and phones instantly. For Geography teachers who want to show physical landscapes, Google Earth Studio is unmatched. You can create a video tour of the Amazon basin, zooming into tributaries while explaining biodiversity zones.
Avoid platforms that require students to download software or create accounts immediately. Friction kills momentum. If a lesson starts with "Please log in," you've already lost ten minutes of engagement. Look for tools that generate shareable links. Embedding these directly into your Learning Management System (LMS) like Canvas or Moodle keeps students in the flow.

Designing Lessons That Actually Work
Don't just throw a map at them. Structure the interaction. A common mistake is creating an "information dump." Too many clickable points overwhelm the user. Instead, use guided tours. Set up your Interactive Map so that step one is mandatory. The student must click the capital city before moving to the rural areas.
Here is a practical workflow for a World War II lesson:
- The Hook: Show a global map with animated arrows showing troop movements. Ask: "Why did the front stall here?"
- The Exploration: Provide a link to a TimelineJS project detailing key battles. Students click each date to read primary source excerpts.
- The Synthesis: Ask students to annotate the map themselves. Add a comment to Stalingrad explaining its strategic value based on the timeline data.
This method moves from observation to analysis to creation. It respects Bloom's Taxonomy without feeling academic. Also, consider accessibility. Ensure your colors have high contrast. Many students are colorblind. Don't rely solely on red vs. green lines to show opposing armies. Use patterns or labels too.
Overcoming Technical Hurdles
Let's be real: technology fails. Wi-Fi drops. Browsers crash. Always have a backup plan. Download your interactive content as a PDF or image sequence if possible. Some tools allow offline modes, but test them beforehand.
Another issue is device disparity. Not every student has a tablet. Design your interactions to work on a mouse and keyboard. Hover effects are great for desktops but useless on touchscreens. Click-to-reveal features are safer bets across all devices. Test your lesson on a smartphone. If the text is too small to read without pinching, simplify the layout.
Data management is another hidden challenge. Where do your sources live? Keep a shared folder for images and documents. Cite everything. When students build their own timelines, they need to practice digital citizenship. Require them to link back to original archives. This teaches research skills alongside historical content.
Assessing Student Understanding
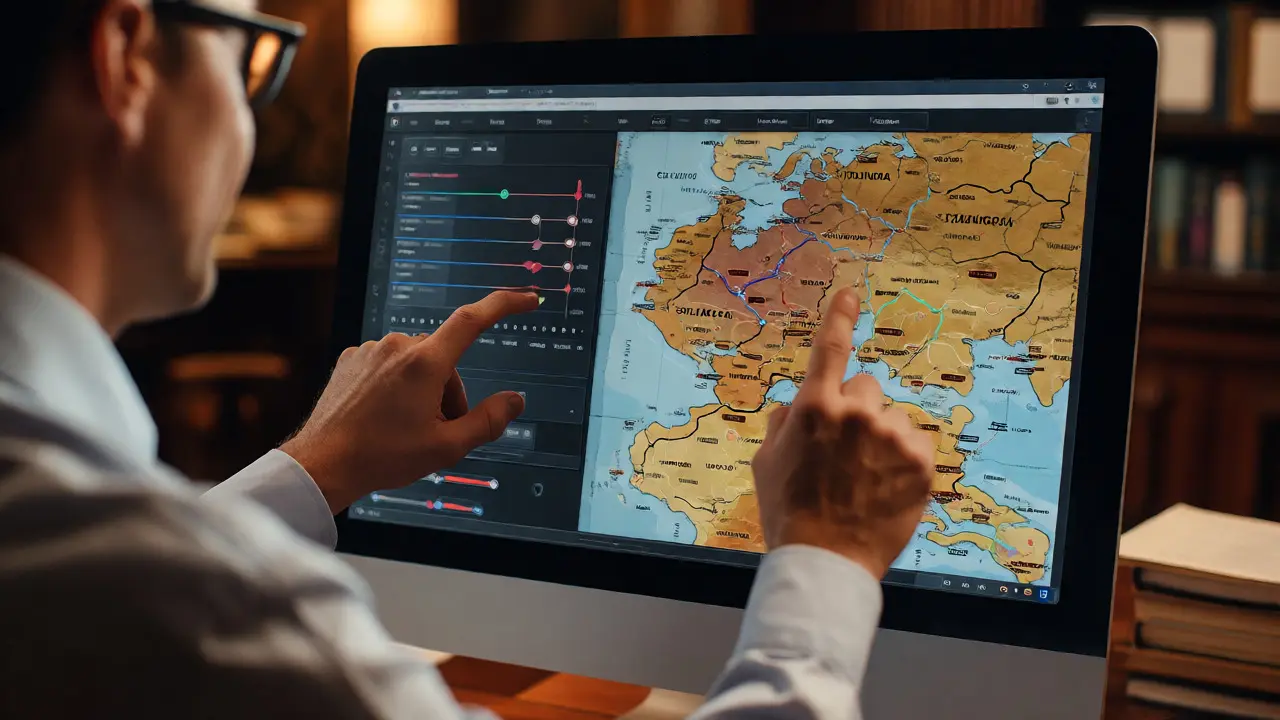
How do you grade an interactive project? Rubrics help. Focus on three areas: accuracy, design, and narrative coherence. Accuracy is straightforward-did they get the dates right? Design looks at usability-is the map easy to navigate? Narrative coherence asks if the story makes sense.
You can also use the tools themselves for assessment. Create a "blank" timeline where students fill in missing events. Or provide a map with no labels and ask them to tag five key cities correctly. This formative assessment happens in real-time. You can see who struggled with the concept of latitude versus longitude by looking at their error rates on the platform dashboard.
Peer review works well here too. Have students swap links to their Educational Timelines. They leave comments on each other's posts. "You missed the Treaty of Versailles here." This collaborative critique builds community and deepens understanding.
Future-Proofing Your Curriculum
These tools aren't going away. In fact, they are evolving. Augmented Reality (AR) is starting to merge with standard maps. Imagine holding a phone over a textbook page and seeing a 3D model of the Roman Colosseum rise up. While not yet standard in every classroom, the trajectory is clear. Familiarizing yourself now puts you ahead of the curve.
Start small. Pick one unit per term to convert into an interactive format. Don't try to digitize everything overnight. Gather feedback from students. Did they enjoy it? Did they learn more? Adjust accordingly. The goal isn't to replace the teacher with a screen. It's to give the teacher better lenses to help students see the world.
Do I need coding skills to create interactive maps?
No, most modern platforms like StoryMap JS or Knight Lab are designed for educators without coding knowledge. They use drag-and-drop interfaces similar to social media posts. You simply upload images, type text, and arrange elements visually.
Are these tools free for schools?
Many core features are free for personal and educational use. Tools like TimelineJS and Knight Lab offer robust free tiers. However, advanced features like removing branding or hosting large datasets may require a paid subscription, though often discounted for educational institutions.
How do I ensure my interactive content is accessible?
Use alt-text for all images, ensure high color contrast, and avoid relying solely on hover states for critical information. Test your map with screen readers if possible, and always provide a downloadable transcript or summary for complex narratives.
Can students collaborate on the same map?
Yes, many platforms support collaborative editing. For example, Google My Maps allows multiple users to add pins and notes simultaneously. This is excellent for group projects where different students research different regions or eras.
What is the best way to assess participation in interactive lessons?
Look beyond completion. Check analytics if available (e.g., time spent on each slide). Better yet, assign a reflective task where students explain *why* they arranged their timeline a certain way, linking their design choices to historical arguments.
