Most organizations collect tons of learning data - course completions, quiz scores, time spent, forum posts - but rarely know what to do with it. The data sits scattered across Learning Management Systems (LMS) and Learning Record Stores (LRS), like pieces of a puzzle with no picture. Building a learning data warehouse changes that. It turns messy, disconnected logs into a single source of truth that helps you see what’s working, who’s falling behind, and where to invest next.
Why a Learning Data Warehouse Matters
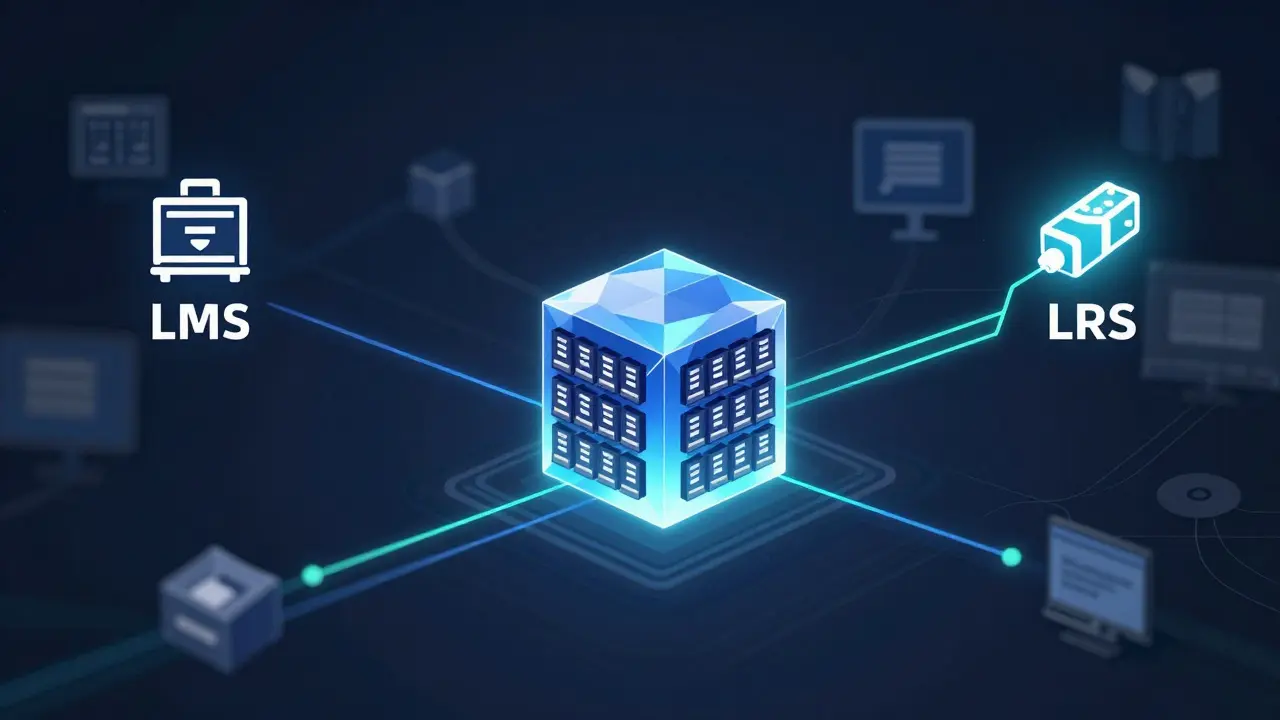
Think of your LMS as the engine of your training program. It delivers courses, tracks completion, and sends basic reports. Your LRS? It’s the quiet recorder. It captures every interaction - a learner pausing a video, clicking a simulation, sharing a resource in a discussion. Neither gives you the full story alone.
Without a data warehouse, you’re stuck with siloed reports. HR sees completion rates. IT sees system errors. L&D sees engagement spikes. But no one sees how a learner’s behavior in Module 3 affects their performance in Module 7. That’s where the warehouse comes in. It pulls all that data together, cleans it, and structures it so you can ask real questions: Do learners who watch the safety video twice pass the certification test faster? Which managers have teams with the highest drop-off rates?
Companies like Siemens and Deloitte use learning data warehouses to cut onboarding time by 30% and reduce compliance failures by over 40%. It’s not magic - it’s just connected data.
What You Need: LMS, LRS, and the Bridge
To build this, you need three things:
- An LMS - like Moodle, Canvas, or Cornerstone. This is where your courses live and basic tracking happens.
- An LRS - like Watershed, xAPI Record Store, or Learning Locker. This captures detailed activity using the xAPI standard (Experience API).
- A data pipeline - the bridge that pulls data from both and loads it into your warehouse.
The LMS gives you structured data: user ID, course ID, score, date. The LRS gives you unstructured, rich behavior: “User 482 clicked ‘Submit’ on simulation 12 at 14:03:22, then rewound to 02:15”. You need both.
Most LMS platforms can send data to an LRS via xAPI. If yours doesn’t, you’ll need a connector or middleware. Don’t skip this step - without xAPI, you’re only getting surface-level data.
Step-by-Step: Building the Pipeline
Here’s how to connect the dots:
- Identify your sources - List every LMS and LRS you use. Note their APIs, authentication methods, and data formats.
- Define your key metrics - What decisions will this data inform? Completion rates? Skill gaps? Retention? Start with 3-5. Don’t try to track everything.
- Set up the LRS - Configure it to receive xAPI statements from your LMS. Test with a single course. Check that clicks, scores, and time stamps appear correctly.
- Choose your warehouse - Use something like PostgreSQL, Snowflake, or even a cloud-based data lake. Avoid Excel. You’ll need to handle millions of records.
- Build the pipeline - Use tools like Apache Airflow, Fivetran, or a simple Python script with requests and pandas. Schedule it to run daily. Don’t rely on manual exports.
- Clean and structure the data - Map user IDs across systems. Standardize course names. Remove test accounts. Turn timestamps into readable dates.
- Test with real questions - Can you answer: “Which learners took longer than average on compliance training?” If yes, you’re ready.
One client in Edinburgh, a mid-sized logistics firm, started with just three courses and 200 learners. Within two weeks, they found that learners who skipped the first module were 60% more likely to fail the final assessment. They redesigned the onboarding flow - and pass rates jumped from 71% to 89%.

What Data to Pull and How to Structure It
Your warehouse needs a clear schema. Here’s a basic structure:
| Table | Key Attributes | Source |
|---|---|---|
| learners | learner_id, name, department, hire_date, role | LMS |
| courses | course_id, title, category, duration, version | LMS |
| enrollments | learner_id, course_id, enrolled_date, completed_date, score | LMS |
| activities | actor_id, verb, object_id, timestamp, result_score, context | LRS |
| completions | learner_id, course_id, completion_date, certificate_id | LMS + LRS |
The activities table is where the magic happens. Each row is an xAPI statement: “User 482 viewed video 12” or “User 482 submitted quiz 5 with score 87”. You can join this with enrollments to see patterns over time.
Don’t forget to include context - like the device used, location (if tracked), or even the time of day. One study from the University of Edinburgh found that learners who completed training after 4 PM had 22% lower retention scores. That’s the kind of insight you only get when data is unified.
Common Pitfalls and How to Avoid Them
Most attempts fail because of three mistakes:
- Trying to do too much too soon - Start with one department, one course type. Don’t try to ingest every LMS in the company on day one.
- Ignoring data quality - Duplicate user IDs? Mismatched course names? Clean this before loading. Garbage in, garbage out.
- Not involving stakeholders - If HR doesn’t know how to use the reports, the warehouse becomes a fancy archive. Show them the first insight early.
Another trap: assuming more data = better insights. You don’t need every click. Focus on actions that tie to outcomes. If your goal is safety compliance, track quiz scores and simulation retries - not how often someone scrolled through a PDF.

What You Can Do With the Data
Once it’s in place, the possibilities open up:
- Identify at-risk learners - Those who log in but never start? Or who re-take the same quiz three times? Flag them for support.
- Optimize course design - If 70% of learners pause at the same video, it’s too long or confusing. Redesign it.
- Measure impact - Did sales training lead to higher conversion rates? Link learning data to CRM or ERP systems to find out.
- Personalize learning paths - Based on past behavior, recommend next courses. “Since you struggled with inventory tracking, try Module 5B.”
- Forecast demand - If 30 new hires join next month, which courses will they need? Pre-load them.
One retail chain in Glasgow used this to reduce onboarding time from 6 weeks to 3. They used activity data to skip modules for experienced hires - saving 12,000 hours of training time in one year.
Tools That Make This Easier
You don’t need to code everything from scratch:
- Watershed - Connects to most LMS platforms and gives ready-made dashboards. Great for non-technical teams.
- Fivetran - Automates data pipelines. Pulls from LMS, LRS, and even HRIS systems like Workday.
- Apache Airflow - For teams with data engineers. Lets you schedule, monitor, and alert on data flows.
- Power BI or Tableau - For visualization. Connect directly to your warehouse and build reports without SQL.
Start simple. Use Watershed if you’re not technical. Use Airflow if you have a data team. Either way, get the data flowing.
Where to Go From Here
A learning data warehouse isn’t a one-time project. It’s a habit. Set up monthly reviews. Ask: What did we learn last month? What should we stop tracking? What new question should we answer?
Don’t wait for perfection. Start with one course. One department. One question. The first insight will show you the value. The rest will follow.
Do I need an LRS if I already have an LMS?
Yes - if you want more than completion rates. An LMS tells you who finished. An LRS tells you how they learned. Did they skip videos? Rewind sections? Click the wrong answer twice? That’s the data that helps you improve courses, not just track them.
Can I build this without a data team?
You can start without one. Tools like Watershed and Fivetran handle the pipeline for you. You’ll still need someone to define what questions to ask and how to interpret the reports. That’s usually an L&D or HR analyst. You don’t need a data engineer - just curiosity and a clear goal.
How long does it take to set up a learning data warehouse?
With the right tools, you can have a working pipeline in 2-4 weeks. The first report - showing completion rates and key activity trends - can be ready in 10 days. Full optimization takes months, but you’ll see value within weeks.
Is xAPI necessary?
Not strictly - you can pull basic data from LMS APIs. But without xAPI, you’ll miss detailed learner behavior. xAPI captures interactions outside the LMS, like mobile apps, simulations, or even real-world tasks. If you want real insights, xAPI is non-negotiable.
What’s the biggest mistake people make?
Trying to collect everything. You don’t need every click. Focus on actions that link to business outcomes - like passing a certification, completing a safety check, or submitting a sales proposal. Start with three metrics. Expand later.

Comments (10)
Tasha Hernandez December 16 2025
Oh wow, another ‘data warehouse’ fairy tale. Let me guess - you also believe putting all the learning data in one place will magically make employees stop zoning out during compliance videos? 🙄 I’ve seen this movie. The LMS is fine. The LRS? A glorified spy cam for your workforce. Next thing you know, HR’s tracking how long you stare at the coffee machine during training. Great. Now I’m being scored on my caffeine habits.
Anuj Kumar December 18 2025
They want you to build this so they can fire people faster. Trust me. Every company that says ‘we want insights’ really means ‘we want to find the lazy ones’. This is just the new performance review with more spreadsheets. They don’t care if you learn. They care if you look like you’re learning. Watch - next year they’ll make you wear a badge that tracks your eye movement during videos.
Christina Morgan December 19 2025
Actually, this is one of the clearest, most practical guides I’ve read on learning data. I work in corporate L&D in Austin and we implemented something similar last year - started with just three courses, like you suggested. The biggest win? We found that people who watched the safety video on their phone during lunch had 40% higher retention than those who sat through it in a conference room. Changed our whole delivery model. You’re right - it’s not about collecting everything. It’s about asking the right question. Thank you for writing this.
Kathy Yip December 20 2025
Wait - so if you track every click, does that mean you’re also tracking when someone pauses to cry because their kid threw up during the training? I mean, I get the value of xAPI, but… is this becoming a little too Orwellian? I’m not against data, but I’m scared of what happens when ‘engagement metrics’ become the new productivity metrics. What if someone’s just having a bad day? Should their ‘low interaction score’ get them flagged? Just… thinking out loud.
Bridget Kutsche December 22 2025
YES. YES. YES. I’ve been screaming this from the rooftops for years. Stop relying on LMS completion rates - they’re meaningless. My team used Watershed to connect our LMS and LRS and within two weeks we discovered that our onboarding course for new nurses had a 60% drop-off right after the burnout prevention module. Turns out, the module was 20 minutes too long and used too much jargon. We cut it to 8 minutes, added real stories from staff, and completion jumped from 42% to 88%. This isn’t tech magic - it’s human insight. Start small. Be curious. You’ll be shocked what you find.
Jack Gifford December 22 2025
Just a quick note - if you’re using Airflow, make sure your DAGs are version-controlled. I saw a team spend three weeks debugging a pipeline because someone edited the Python script directly on the server. No git. No backups. Just ‘it worked yesterday’. Also, don’t forget to handle timezones. We had learners from Hawaii showing up as ‘never logged in’ because their timestamps were being converted to EST. It’s not sexy, but data hygiene is 80% of the battle.
Sarah Meadows December 22 2025
Forget the LRS. The real problem is that American companies are outsourcing their training to India and then pretending they need ‘advanced analytics’ to cover it up. You don’t need a data warehouse - you need to stop hiring cheap offshore trainers who don’t even speak English well enough to explain why the video is frozen. This whole thing is a distraction. Fix your hiring. Fix your content. Stop chasing data like it’s a magic wand.
Nathan Pena December 23 2025
Let’s be brutally honest: 95% of organizations implementing this will fail. Why? Because they have no data governance, no data steward, and no clear KPIs beyond ‘we want to look smart’. The schema you outlined? Beautiful. But in practice, learner_id mismatches, inconsistent course naming conventions, and legacy systems with no API access will turn this into a six-month dumpster fire. And when it fails, they’ll blame ‘the tool’ - not the lack of strategic alignment. This isn’t a technical problem. It’s a leadership failure.
Mike Marciniak December 24 2025
They’re not building a warehouse. They’re building a surveillance network. Every click, every pause, every retry - it’s all being stored. Who owns this data? Can you opt out? Can you request it be deleted? No. Because the moment you say ‘yes’ to xAPI, you’ve signed away your right to privacy in the name of ‘learning optimization’. This isn’t innovation. It’s corporate control dressed up in analytics jargon.
VIRENDER KAUL December 26 2025
While the technical architecture presented is theoretically sound, the practical implementation remains fraught with systemic inefficiencies. The absence of a centralized identity resolution protocol across disparate LMS and LRS environments renders the proposed schema inherently fragile. Furthermore, the assumption that xAPI statements can be reliably ingested without pre-validation of semantic consistency introduces significant data integrity risks. It is imperative that organizations establish a formal data governance framework prior to pipeline deployment, otherwise the resulting warehouse will function as a high-volume repository of noise rather than insight.