

You study hard. You do your flashcards. You attend classes. Yet, when someone asks you how far along you are, you hesitate. Is it a B1? Maybe an A2? The truth is, most learners fly blind. We rely on gut feelings or vague feedback from teachers who see twenty students a day. But what if you could see your progress like a fitness tracker shows steps? Language Learning Analytics makes this possible. It turns messy study habits into clear data points.
This isn't about replacing human intuition with cold numbers. It's about spotting the holes in your knowledge before they become roadblocks. Imagine knowing exactly which verb tenses trip you up, or realizing that while your reading is strong, your listening comprehension lags behind by three months. That insight changes everything. It stops you from wasting time on things you already know and forces you to tackle the actual gaps. Let's look at how tracking CEFR progress works and why it matters for serious learners.
Why Guessing Your Level Fails
The Common European Framework of Reference for Languages (CEFR) divides proficiency into six levels: A1, A2, B1, B2, C1, and C2. Sounds simple, right? In practice, it's murky. Self-assessment is notoriously unreliable. Studies consistently show that beginners overestimate their abilities, while advanced learners underestimate them due to higher standards for themselves. This is known as the Dunning-Kruger effect applied to linguistics.
Without data, you might spend weeks perfecting basic greetings when you should be mastering complex subjunctive moods. Or worse, you might attempt native-level media without having the foundational vocabulary to support it, leading to frustration and burnout. Analytics provides objective metrics that bypass these cognitive biases. By analyzing performance across thousands of micro-skills, we get a precise map of where you stand today, not where you hope to be.
How Data Maps to CEFR Levels
Modern language platforms don't just ask "Are you good?" They track specific competencies. Each word learned, each sentence constructed, and each audio clip understood contributes to a weighted score. These scores align with CEFR descriptors. For instance, reaching B1 requires understanding the main points of clear standard input on familiar matters regularly encountered in work, school, and leisure. Analytics tools measure whether you can actually do that, based on error rates and response times.
Consider a typical progression model. At A2, you might correctly conjugate present tense verbs 90% of the time. But if your past tense accuracy hovers around 60%, you have a gap. A traditional curriculum might move everyone forward regardless. An analytics-driven approach flags that specific deficit. It suggests targeted exercises until that metric hits 85%. This granular view ensures that your B1 certification isn't just a piece of paper, but a reflection of solid, usable skill.
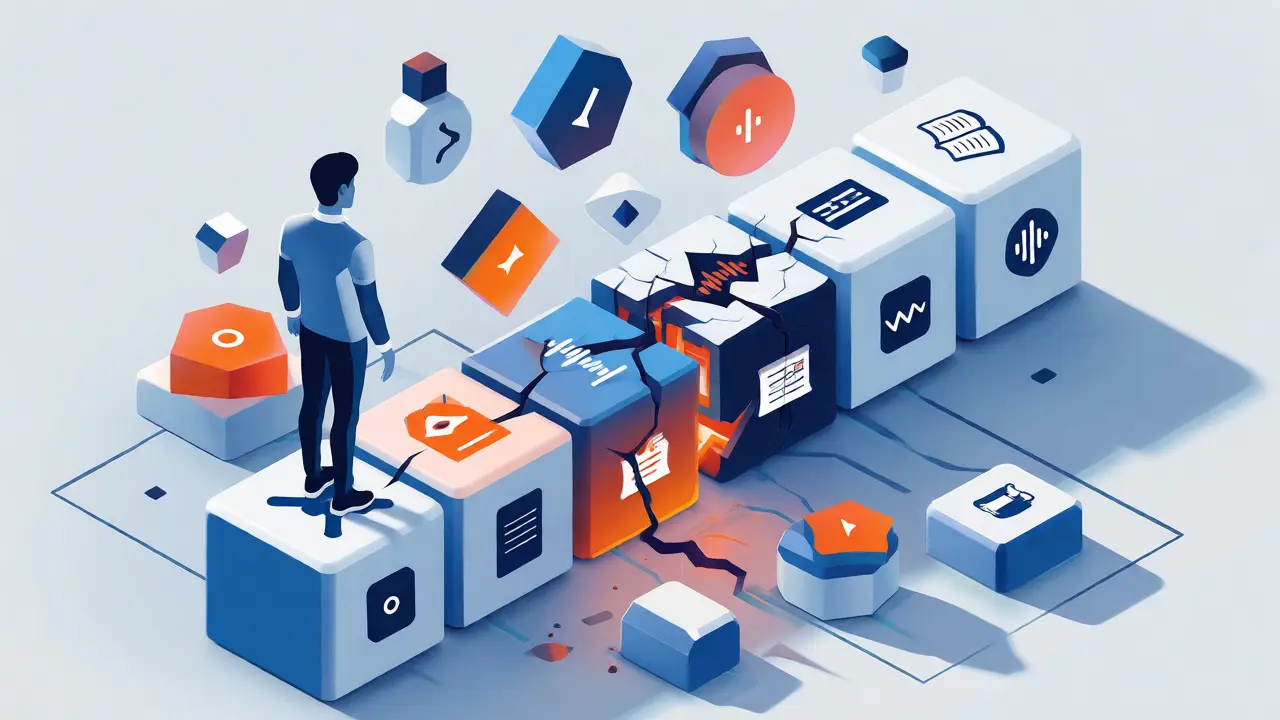
Identifying Hidden Proficiency Gaps
Gaps aren't always obvious. You might feel confident speaking because people nod and smile. But those smiles might hide confusion. Analytics digs deeper by correlating different skills. Do you understand written text better than spoken audio? If your reading comprehension scores are 20% higher than your listening scores, you have an auditory processing gap. This often happens with learners who rely heavily on subtitles or textbook dialogue.
Another common hidden gap is register awareness. You might know formal grammar perfectly but fail in casual slang contexts. Data reveals this by tracking performance across different content types. News articles versus movie clips. Business emails versus text messages. If your accuracy drops significantly in informal contexts, you need immersion strategies, not more grammar drills. Spotting these disparities early saves months of ineffective study.
The Role of Adaptive Testing
Adaptive Testing is the engine behind accurate analytics. Unlike static tests where everyone answers the same questions, adaptive systems adjust difficulty in real-time. If you answer a question correctly, the next one gets harder. If you miss it, the next one gets easier. This pinpoints your exact ability level with fewer questions.
For example, Duolingo’s English Test uses Item Response Theory (IRT) to estimate proficiency. It doesn’t just count right answers; it weighs the difficulty of the questions you answered. This method correlates strongly with standardized tests like IELTS or TOEFL. When you integrate such adaptive assessments into your daily routine, you get continuous updates on your proficiency gaps. You’re not waiting for a quarterly exam to find out you’ve plateaued. You see the trend line dip or rise week by week.
Building a Data-Driven Study Plan
So, how do you use this info? Start by defining your target CEFR level. Say you want B2 in Spanish within six months. Break down the requirements. B2 demands interacting with a degree of fluency and spontaneity that makes regular interaction with native speakers quite possible without strain for either party.
- Track Input: Monitor hours spent listening vs. reading. Are they balanced?
- Measure Output: Record speaking sessions. Use AI tools to analyze pronunciation and syntax errors.
- Analyze Retention: Check spaced repetition success rates. Are you forgetting words faster than you learn them?
If your retention rate drops below 80%, slow down new material. Increase review frequency. If your speaking confidence scores lag behind your passive knowledge, prioritize output tasks. Adjust your schedule based on these metrics, not on arbitrary goals like "study 30 minutes every day." Quality and relevance matter more than raw time.

Common Pitfalls in Language Analytics
Data can mislead if interpreted poorly. One major pitfall is vanity metrics. Seeing a streak of 100 days feels great, but it tells you nothing about proficiency. Did you study effectively during those days? Or did you just click through easy lessons to keep the flame alive? Focus on competency-based metrics, not activity-based ones.
Another trap is over-reliance on automated scoring. AI detectors for pronunciation are improving but still struggle with regional accents or rapid speech nuances. Treat their feedback as a guide, not gospel. Always cross-reference digital insights with human interaction. If the app says your accent is perfect but natives constantly ask you to repeat yourself, trust the humans. Analytics supports learning; it doesn't replace social validation.
| Feature | Traditional Classroom | Data-Driven Approach |
|---|---|---|
| Pacing | Fixed schedule for all students | Personalized based on mastery |
| Feedback Loop | Weekly or monthly exams | Real-time performance metrics |
| Gap Identification | General teacher observation | Specific skill deficit mapping |
| Resource Allocation | Equal time for all topics | Focused effort on weak areas |
| Motivation Source | External grades/rewards | Visible progress trends |
Tools for Tracking Progress
You don't need a PhD in statistics to start. Several accessible tools help visualize Learner Data. Anki, the popular flashcard software, offers detailed statistics on card recall rates. It shows you exactly which cards cause trouble. For broader context, platforms like LingQ track known words and reading speed. Some newer apps integrate directly with CEFR benchmarks, providing instant level estimates after quizzes.
If you're tech-savvy, consider exporting your data to spreadsheets. Plotting your accuracy percentages against time creates powerful visualizations. You might notice a correlation between sleep quality and test scores, or between weekend binge-studying and Monday morning forgetfulness. These patterns empower you to optimize your lifestyle around your learning goals.
Can analytics replace a language tutor?
No, analytics complements tutoring rather than replaces it. Tutors provide cultural nuance, emotional support, and conversational practice that data cannot fully capture. However, analytics helps tutors focus their limited time on your specific weaknesses instead of teaching generic lessons.
How often should I check my CEFR progress metrics?
Daily checks can lead to anxiety over minor fluctuations. Weekly reviews of aggregate data are usually sufficient. Look for trends over two-week periods. If your accuracy on a specific skill type drops consistently for three weeks, intervene immediately.
Is self-reported CEFR level accurate enough for job applications?
It depends on the employer. Many companies now require verified certificates (like DELF, DELE, or Goethe-Zertifikat). However, using analytics to prepare for these exams significantly increases pass rates. Use data to bridge the gap between your perceived level and certified reality.
What is the biggest mistake learners make with data?
Ignoring qualitative feedback. Numbers tell you *what* went wrong, but not necessarily *why*. A high error rate in prepositions might stem from direct translation interference from your native language. Analytics flags the error; linguistic analysis explains the cause. Combine both for true improvement.
Do free apps provide reliable CEFR tracking?
Free apps offer decent directional guidance but lack the precision of paid, standardized tests. They are excellent for identifying broad gaps and maintaining momentum. For critical milestones, like university admission or professional certification, supplement app data with official mock exams.

Comments (14)
Sherri Jones September 29 2026
This is such a vital topic! 📊 I’ve been using Anki stats for years and it completely changed how I approach my Spanish studies. The idea of treating language learning like fitness tracking is spot on. 💪 It removes the guesswork so you can actually see where your weak points are instead of just feeling like you're stuck in a plateau. Highly recommend checking out those retention rates if you haven't already! ✨
LoriBeth Blair September 29 2026
Most people don't understand that data doesn't equal fluency. You can have perfect metrics and still sound like a robot. It's simple really, you need to talk to humans not charts.
Charles Reah October 1 2026
I appreciate the balanced perspective here. While analytics provide objective metrics, we must remember that language is inherently social. As an educator, I've seen students obsess over their B1 score while failing to engage in meaningful conversation. The data should serve the learner, not dictate the entire experience. Let's ensure we keep the human element at the center of our pedagogical strategies.
SHANNON GRUBER October 2 2026
Overrated.
Streaks are vanity metrics as the article admits yet everyone falls for them. Just study normally without the extra app clutter.
Prayagraj Medicose October 4 2026
Dude, do you think these apps are actually helping or just harvesting our brain data? 😰 They track every micro-skill but who owns that info? I bet they sell it to ad agencies to target us with more useless courses. We are flying blind not because we lack data but because the data is rigged against us. Wake up!
Brad Walker October 5 2026
The tragedy of modern education is the reduction of art to algorithms... 🎭 We quantify the soul of communication until it bleeds numbers. Is it progress or merely a cage of precision?
Howard Hurd October 5 2026
Finally someone says it. CEFR is garbage anyway. American English dominance means these European standards are irrelevant for real world usage. :P
Manoj Kumar October 7 2026
The methodology presented lacks rigorous statistical validation regarding cultural bias in adaptive testing. Furthermore, the assumption that error rates correlate linearly with proficiency ignores pragmatic competence. One must consider the socio-linguistic context before accepting these digital insights as absolute truth.
Hemali Jaiswal October 9 2026
What a beautifully articulated piece! 🌟 It truly illuminates the foggy landscape of self-assessment. I love how it encourages us to look beyond the surface level of 'streaks' and dive into the nuanced waters of actual competency. This kind of insight is a gift to all learners navigating the complex river of acquisition. Thank you for sharing this wisdom! 🙏
Sean Eagen October 10 2026
Data is good but dont forget discipline. Apps cant force u to study. U gotta want it.
Kieran Mitchell October 10 2026
Wait... hold on!!! 🛑 Are we seriously trusting algorithms??? 🤯 What happens when the AI gets it wrong???! 🚨 Then what??! Do we just ignore our feelings??! 🤷♂️ It feels so cold... so sterile... like learning from a machine that doesn't know pain... 😢😢😢
Darlene Hopkins October 11 2026
Love this focus on empathy in learning. Data helps us understand ourselves better.
Bryce Imbriale October 11 2026
YES!! 🔥 This is exactly what I needed to hear today. Stop guessing start measuring. Your future self will thank you for looking at those graphs. Go crush those gaps!! 💪💪
william mcstay October 13 2026
Good point about hidden gaps. Most people miss register awareness entirely.