You can have the best strategy in the world, but if you don't know what you're actually doing when the market moves, you're guessing. Most traders lose money not because they lack a good entry signal, but because they repeat the same mistakes without realizing it. A crypto trading journal is the only mirror that shows you exactly where your edge lies and where your behavior is costing you.
Keeping a detailed record of every trade isn't just about admin work; it's the single most effective habit for turning inconsistent results into a systematic process. Whether you are day trading Bitcoin or swing trading altcoins, the data you capture today becomes the roadmap for your profitability tomorrow.
Why Your Memory Is Lying to You
We all think we remember our trades accurately. We recall the big wins vividly and conveniently forget the small losses that added up over weeks. This is known as recency bias and confirmation bias. Without a written record, you are relying on a faulty memory system to make high-stakes financial decisions.
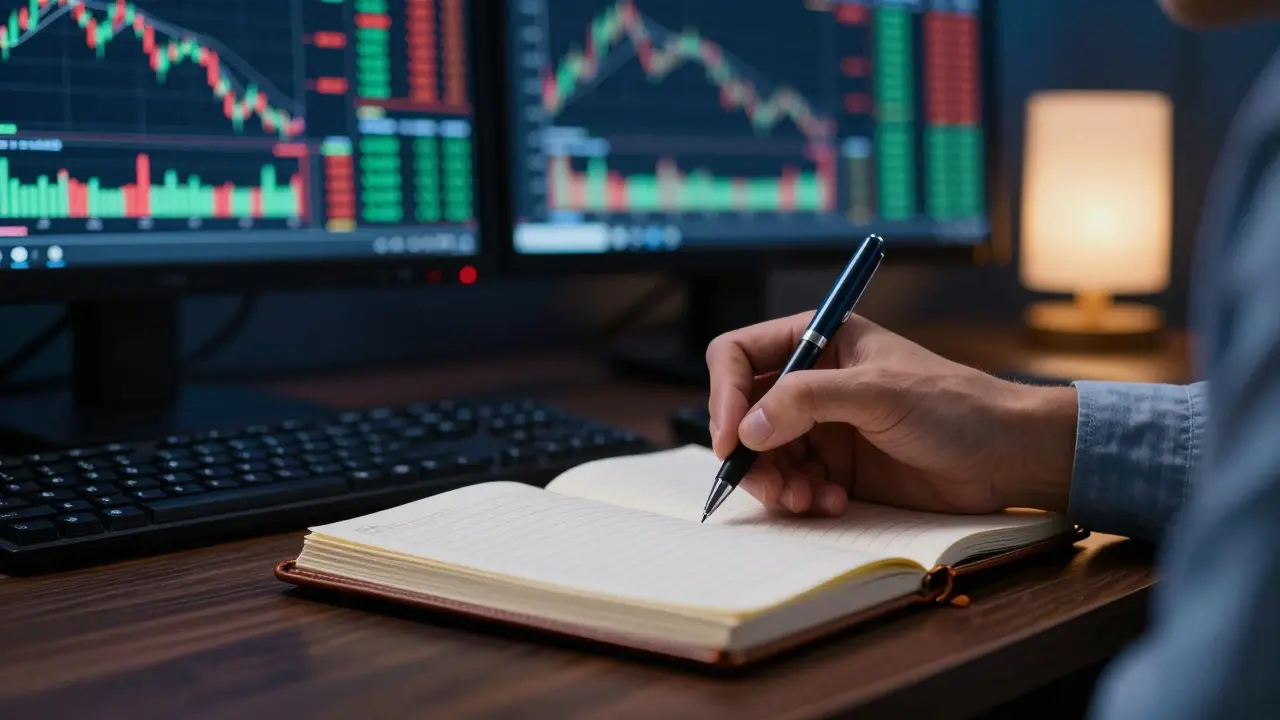
A crypto trading journal forces accountability. When you have to document the entry price, exit price, and the reason for the trade before you even place it, you slow down. That pause is crucial. It stops impulsive, emotion-driven clicks. Over time, this discipline reveals patterns you never noticed. You might find that you consistently lose money on trades taken after 8 PM local time, or that your 'breakout' strategy works in bull markets but fails miserably during sideways consolidation.
The goal isn't just to track profit and loss. It is to identify the specific behaviors that lead to those outcomes. By separating your emotional reaction from the factual data of the trade, you start making decisions based on probability rather than hope.
What to Record in Every Entry
If you want actionable insights, you need more than just "Bought BTC at $60k." You need context. Here are the essential fields every trader should include in their journal:
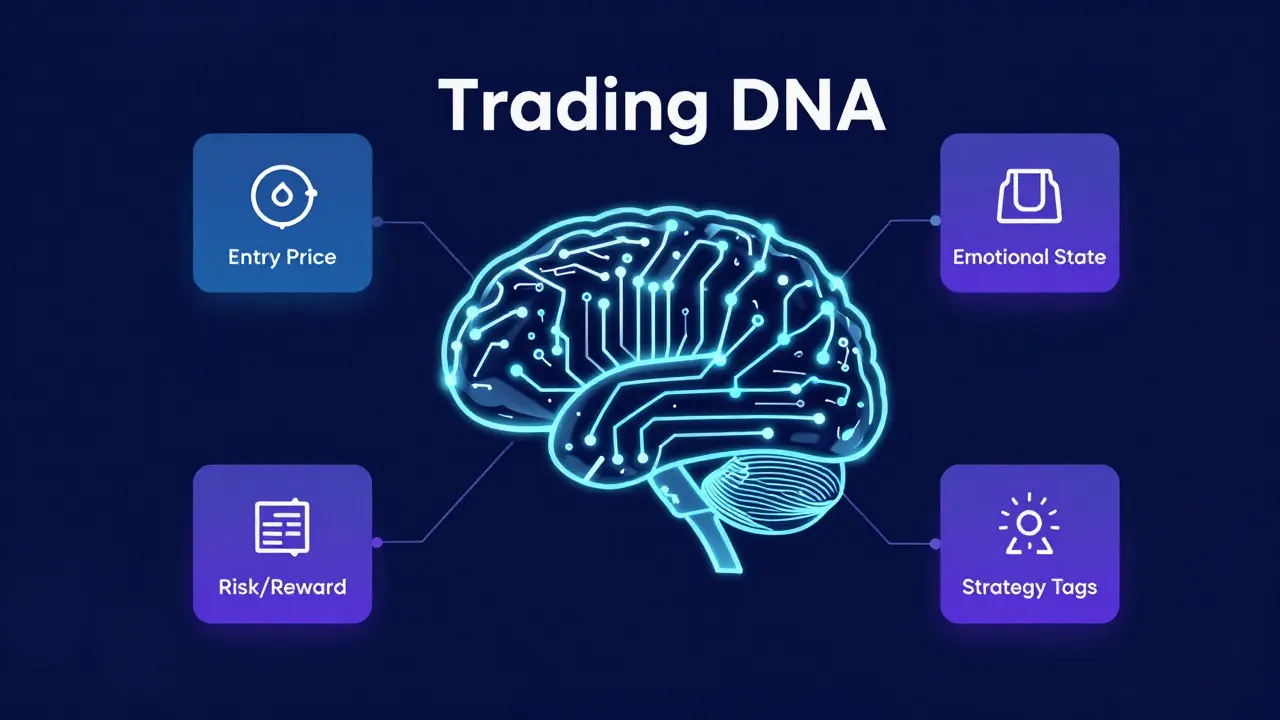
- Entry and Exit Details: Exact prices, date, time, and the trading session (e.g., London Open, US Close). Timing matters because volatility shifts drastically between sessions.
- Strategy Tags: Label the setup. Was it a Fair Value Gap (FVG) fill? A liquidity sweep? A simple moving average crossover? Tagging allows you to filter later to see which specific setups are profitable.
- Market Context: What was the broader trend? Was there major news like an ETF approval or a Fed rate decision? Crypto markets react heavily to macro events.
- Emotional State: Rate your confidence from 1-10. Were you feeling FOMO (Fear Of Missing Out)? Revenge trading after a loss? Boredom? Emotional triggers are often the root cause of bad execution.
- Screenshots: Save the chart view at the moment of entry and exit. Numbers tell you what happened; charts show you why.
- Risk Metrics: Position size, stop-loss distance, and the planned Risk/Reward ratio. Did you move your stop loss? Did you take profit early?
Recording these details creates a database of your own trading DNA. Instead of asking "Did I win?" you can ask "Did I follow my plan?" Those are two very different questions with different answers.
Key Metrics That Actually Matter
Once you have data, you need to analyze it. Tracking net profit is obvious, but it’s not enough. Focus on these core metrics to gauge true performance:
| Metric | Definition | Why It Matters |
|---|---|---|
| Win Rate | Percentage of trades that close in profit. | Shows consistency, but doesn't account for trade size. |
| Risk/Reward Ratio (R:R) | Potential gain divided by potential loss per trade. | A low win rate can still be profitable with a high R:R. |
| Profit Factor | Total Gross Profit / Total Gross Loss. | A factor above 1.5 indicates a sustainable edge. |
| Expectancy | Average profit per trade minus average loss per trade. | Tells you how much you make (or lose) on average per click. |
For example, if you have a 40% win rate but your average winner is three times larger than your average loser, you are likely profitable. Many traders quit because they focus solely on winning more often, ignoring the math of their risk-reward structure. Your journal helps you calculate these numbers objectively.
Choosing Your Tool: Spreadsheets vs. Dedicated Apps
You have two main paths for journaling: manual spreadsheets or specialized software. Both have merits depending on your stage as a trader.
Google Sheets or Excel are free and highly customizable. You can build a template that tracks exactly what you want. The downside is that data entry is manual and prone to errors. If you trade frequently, spending 20 minutes copying and pasting data into a sheet after each session can become a chore you eventually skip. However, for beginners, the act of manually entering data reinforces the learning process.
Dedicated Platforms automate much of this work. Tools like CryptoJournal is a platform designed specifically for cryptocurrency traders, offering features like position sizing calculators and fee tracking alongside performance graphs. Other options include TraderSync which provides AI insights and integrated backtesting across multiple asset classes including crypto, and Finestel known for robust tag-based tracking and screenshot archiving capabilities.
Apps like Notion or Evernote allow for visual journals where you can embed charts and voice memos, which is great for qualitative analysis. But for quantitative depth, dedicated trading journals offer dashboards that automatically calculate your win rates and drawdowns. If you are serious about scaling, investing in a tool that syncs with your exchange or TradingView saves hours of administrative time.
The Review Process: Where Improvement Happens
Writing the journal is only half the battle. The real value comes from reviewing it. If you log trades but never look back, you’re just keeping a diary, not improving your business.
Set aside time once a week for a short review and once a month for a deep dive. Ask yourself these specific questions:
- Which setups are working? Filter your journal by strategy tags. If your "Support Bounce" strategy has a negative expectancy, stop trading it until you fix the flaw.
- Where am I bleeding money? Look at your losing trades. Are they all happening in the first hour of the market open? Are they all on low-volume altcoins? Identify the common denominator.
- Am I following my rules? Check your emotional notes. Did you move your stop loss out of fear? Did you enter late out of FOMO? These behavioral leaks destroy accounts faster than bad strategies.
- Is my risk consistent? Ensure you aren't increasing position size after a win (overconfidence) or decreasing it after a loss (fear).
This weekly ritual transforms vague feelings of "I'm having a bad month" into concrete data points like "My win rate drops by 15% when I trade during high-impact news events." Now you have a solution: avoid trading during news.
Common Pitfalls to Avoid
Even experienced traders make mistakes with their journals. Don't fall into these traps:
- Inconsistency: Skipping entries because "it was a small trade." Small trades compound. If you ignore them, your data is skewed.
- Vagueness: Writing "bad trade" instead of explaining why. Was it a bad entry? Bad exit? Bad risk management? Specificity drives improvement.
- Over-Complication: Creating a spreadsheet with 50 columns you never fill. Start simple. Consistency beats complexity.
- Ignoring Psychology: Focusing only on P&L. Your mindset is your biggest variable. Track it.
Remember, the goal of a crypto trading journal is not to prove you are right. It is to reveal the truth so you can adapt. In the volatile world of cryptocurrencies, adaptation is the only permanent advantage.
How long does it take to see improvements from using a trading journal?
Most traders begin to notice patterns within 30 to 50 logged trades. However, significant strategic adjustments and measurable performance improvements typically occur after 3 to 6 months of consistent journaling and weekly reviews. Patience is key as you build a statistically significant sample size.
Should I use a free spreadsheet or paid software?
Start with a free Google Sheet if you are new to trading or have limited capital. It forces you to understand the metrics deeply. As your trading volume increases and manual entry becomes a bottleneck, switch to paid software like CryptoJournal or TraderSync to save time and access advanced analytics.
What is the most important metric to track?
While Profit Factor is crucial for overall health, the most actionable metric is often your adherence to your trading plan. Tracking how often you follow your rules versus how often you deviate due to emotion provides the quickest path to behavioral correction and long-term stability.
Can a journal help with trading psychology?
Yes, significantly. By documenting your emotional state before and after trades, you can identify triggers like fear, greed, or revenge trading. Recognizing these patterns allows you to implement pre-trade checks and mindfulness techniques to mitigate emotional decision-making.
Do I need to journal every single trade?
Absolutely. Omitting small or insignificant trades skews your data and hides recurring habits. Every trade, regardless of size, contributes to your overall expectancy and reflects your discipline. Consistent logging ensures your performance analysis is accurate and representative.

Comments (12)
Cynthia Lamont May 24 2026
Oh, please. Another generic 'journal your trades' post like we haven't heard this a million times?
You're telling people to write down every little thing they do as if writing in a diary is going to magically fix their blown accounts. It's adorable, really. Most of you are just gambling with crypto and pretending it's 'trading'.
If you can't make money without a spreadsheet, you don't have an edge, you have a hobby. Stop hiding behind data entry. The market doesn't care about your feelings or your screenshots. It cares about liquidity.
And don't get me started on the grammar in these comments usually. But I digress. This is all fluff for people who want to feel productive while losing money.
Kirk Doherty May 24 2026
i mean its not bad advice but yeah most people skip it after week two
Dmitriy Fedoseff May 26 2026
The philosophical underpinning of this article ignores the chaotic nature of human psychology when subjected to financial pressure. You suggest that recording emotions stops them from affecting decisions. This is naive. Emotions are not logical entities to be cataloged; they are visceral reactions to survival threats perceived by the amygdala.
To think that a simple tag in a software application can override millions of years of evolutionary wiring is absurd. Furthermore, the reliance on Western-centric trading metrics ignores how different cultures perceive risk and reward. In my experience, the concept of 'loss' varies significantly across borders, making a universal journaling template culturally imperialist at best and useless at worst. You are trying to impose order on chaos with a ruler made of straw.
Meghan O'Connor May 26 2026
This article is painfully obvious and reads like it was written by someone who has never actually traded more than $100.
Who needs a journal when you can just look at your PnL? If you're losing, stop trading. Simple. The idea that you need to track 'emotional state' is ridiculous. Professionals manage their emotions internally, they don't need a therapist app.
Also, the suggestion to use spreadsheets is outdated. Use Python scripts to automate data extraction from API endpoints. If you can't code, you shouldn't be trading. End of story.
Morgan ODonnell May 28 2026
I get where everyone is coming from but honestly just starting small helps a lot. I used to feel overwhelmed too. Writing down why I took a trade makes me feel calmer even if I lose. It’s nice to see progress over time rather than just staring at red numbers. Thanks for sharing this perspective, it’s encouraging to know others struggle with this too.
Liam Hesmondhalgh May 29 2026
Typical American influence pushing these soft skills onto traders. We Irish prefer hard facts and less emotional nonsense. Your grammar is also atrocious in places, did you go to school?
Trading is about discipline, not keeping a diary. If you need to record your feelings, you are weak. Real traders take the hit and move on. Stop coddling yourselves with these 'journals' and start respecting the market. It is brutal and does not care about your 'edge'. Get some backbone.
Patrick Tiernan May 30 2026
honestly this is such basic stuff why are we even discussing it
everyone knows you gotta track your trades its like saying you should brush your teeth
but sure lets pretend this is revolutionary advice for the masses
also the formatting here is trash who wrote this garbage
Patrick Bass May 30 2026
While the sentiment regarding consistency is valid, the execution of this argument lacks precision. One must consider the statistical significance of the sample size before drawing conclusions from such journals. A few weeks of data is merely noise. However, the point about separating emotion from data is technically sound, provided one adheres to strict quantitative methods rather than subjective qualitative assessments.
Amy P June 1 2026
Wait, so you're saying I need to write down EVERYTHING?!
That sounds exhausting! What if I forget? What if the app crashes?
I tried once and it felt like homework. Do I really need to screenshot every single chart? That takes forever!
But... maybe it would help me stop losing money on those random altcoin pumps? Ugh, I hate feeling like I'm guessing. Is there a shortcut? Please tell me there's a shortcut!
Ashley Kuehnel June 2 2026
Hey Amy! Don't worry, you dont need to do it perfectly at first. Just try logging the big ones.
I use a simple sheet and it helps me see patterns i didnt notice before. Like i always lose when i trade late at night lol.
It might feel like work now but trust me it gets easier. You got this! Let me know if you need a template link.
adam smith June 2 2026
It is quite interesting how many individuals fail to grasp the fundamental necessity of documentation. While I appreciate the friendly tone of previous commenters, let us remain formal in our discourse. The act of journaling is not merely a suggestion; it is a requisite component of professional risk management. Without empirical evidence of one's actions, improvement is statistically impossible. Therefore, one should adopt this practice with immediate effect.
Mongezi Mkhwanazi June 3 2026
Let us delve deeper into the epistemological crisis facing modern retail traders; for, without a rigorous and meticulously maintained ledger of transactions, one is merely adrift in a sea of stochastic volatility, devoid of any anchor to reality. The notion that one can simply 'feel' their way through the markets is, frankly, laughable to anyone who has studied behavioral economics; thus, I implore you to cease your frivolous dismissal of data collection and embrace the cold, hard truth of your own incompetence. Furthermore, the punctuation in this very thread is abysmal, reflecting the general decline of intellectual rigor in online discourse; therefore, I shall continue to observe from the sidelines, judging silently while you all squabble over trivialities, knowing full well that true mastery requires solitude and reflection, not this cacophony of uneducated opinions.